I was looking after the different options offered by the Elastic Stack to monitor my homelab which is based of an VMWare vSphere with a dual node infrastructure and has it happen Elastic has released an integration for it.
During this article I will assume you are familiar with the concept of elastic-agent infrastructure and already have a dedicated agent deployed and register to your elastic stack.
Integration presentation
Elastic has introduced their elastic-agent which ingestion is based on integration. The goal is to have a unique and simple way to ingest data from external sources (logs, metrics…). Difference being the integration gather all the historical tasks of data parsing, dashbaord creation, maintenance and scaling.
For the case of this integration, it’s taking advantage of the govmomi library and embed it directly into it, so no requirements is needed which makes the integration installation pretty straight forward.
vSphere Metrics Configuration
The integration will gather the metrics from your vcenter sdk endpoint who should look something like <https://your_vcenter_fqdn/sdk>. Best practices is to create a dedicated user who will fetch periodically the metrics with limited rights.
Let’s start by creating this user :
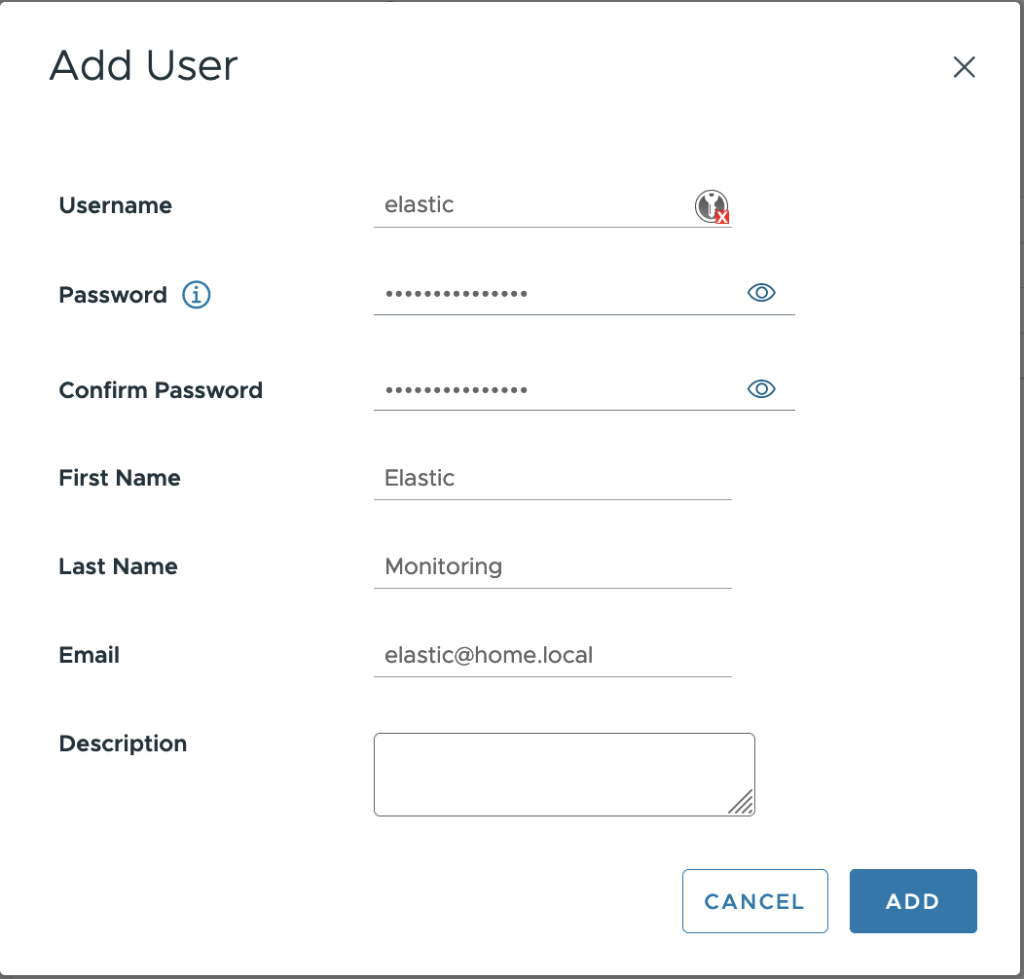
Go to your vSphere Client Web, administration -> users & group -> Select your local Domain for me it’s “home.local”, default point out to “vsphere.local” and click the add button.
Create a dedicated user “elastic”.
Now that the user has been created let’s create the group :
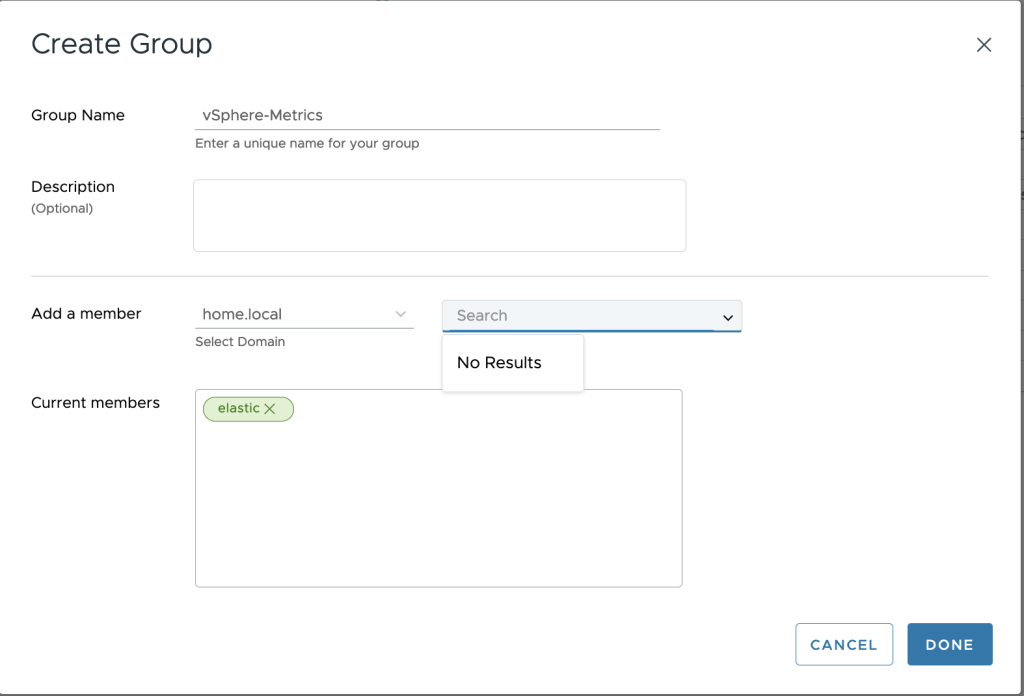
Go to your vSphere Client Web, administration -> users & group -> groups and click the “add group” button.
Create a dedicated group “vSphere-Metrics” and affect Elastic as a member.
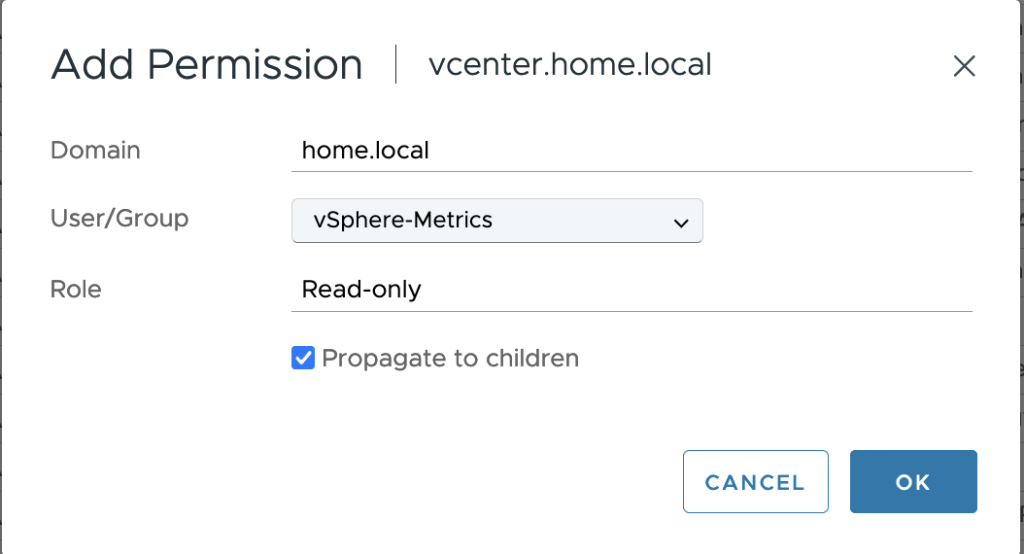
Now both user and group has been created, let’s affect the group with associated permission to the vcenter. Go to your vSphere Client Web, Hosts & Cluster -> permissions -> click “add” at vcenter level.
Fill the permission to fit previously group. In order to limit the group rights and as I don’t have a strict security policy at home, I’m choosing the global “Read-Only” permission. Depending on your environment, you could imagine about restricting more by creating your own role and apply it to your group.
vSphere Logs Configuration
When it comes to logs, vSphere integration will rely on generic logs forwarding. For this you have to configure your vSphere appliance to forward the logs to the elastic-agent TCP port (more to come).
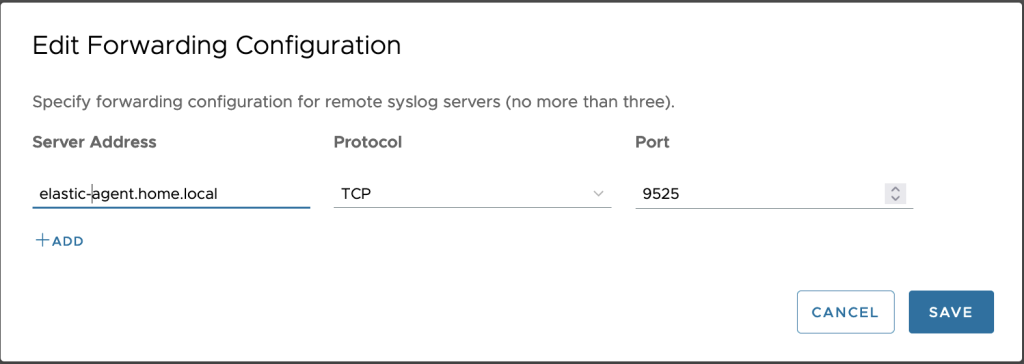
To achieve it, go to your vSphere management console <https://your_vcenter_fqdn:5480> -> syslog -> click “edit” button.
Fill the configuration with your option, port 9525 being the default integration listening port:
Integration deployment
Now that both Metrics and Logs requirements are completed, we can add the integration to our policy and configure to match previous steps:
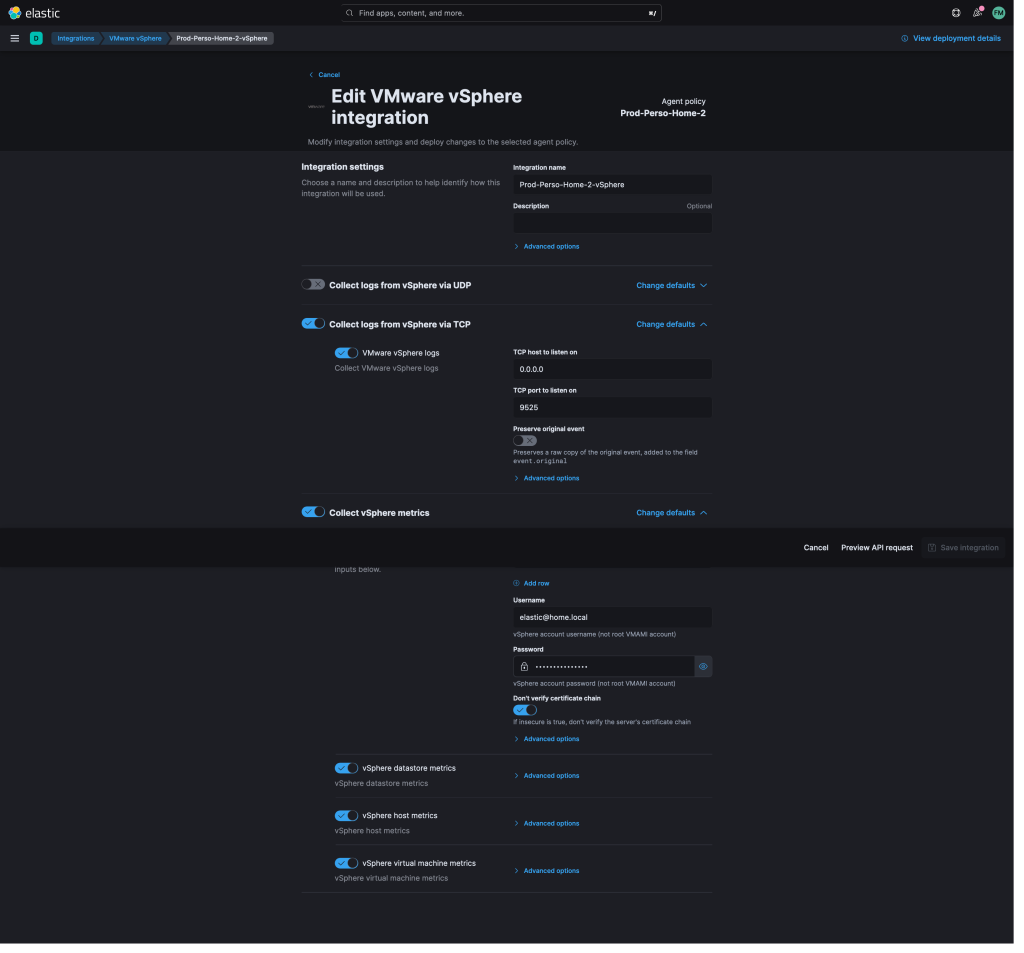
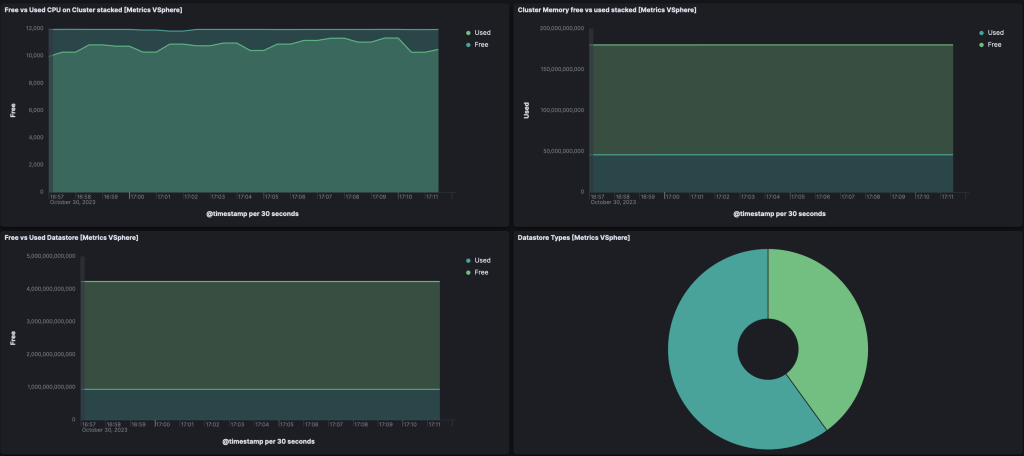
Once saved and deployed to your elastic-agent, you should see default Kibana Metrics vSphere Dashboard automatically appear.
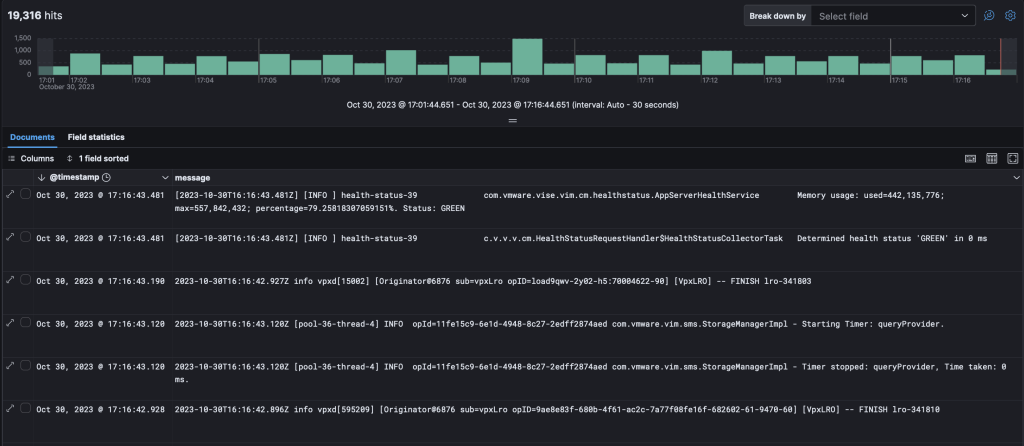
Same for logs that you can find on your Kibana -> Discover and search for vsphere.log datatream :
KQL search : data_stream.dataset : “vsphere.log”
Hi
Where do you need to install elastic agent?
Greetings
Elastic agent needs to be installed on a standalone vm/container/server and enrolled in Elastic.
You can find the process in Elastic documentation : https://www.elastic.co/guide/en/fleet/current/elastic-agent-installation.html
I don’t think the title of your article matches the content lol. Just kidding, mainly because I had some doubts after reading the article.
Your article helped me a lot, is there any more related content? Thanks!
Thanks for sharing. I read many of your blog posts, cool, your blog is very good.
Your point of view caught my eye and was very interesting. Thanks. I have a question for you.
Can you be more specific about the content of your article? After reading it, I still have some doubts. Hope you can help me.